Los Angeles multifamily permits, 2023 to 2026, in numbers
An analysis of 1,726 multifamily new-building permits in the City of Los Angeles: how many were filed and issued, how long they took, how tall they are and where they stand today.
Key findings
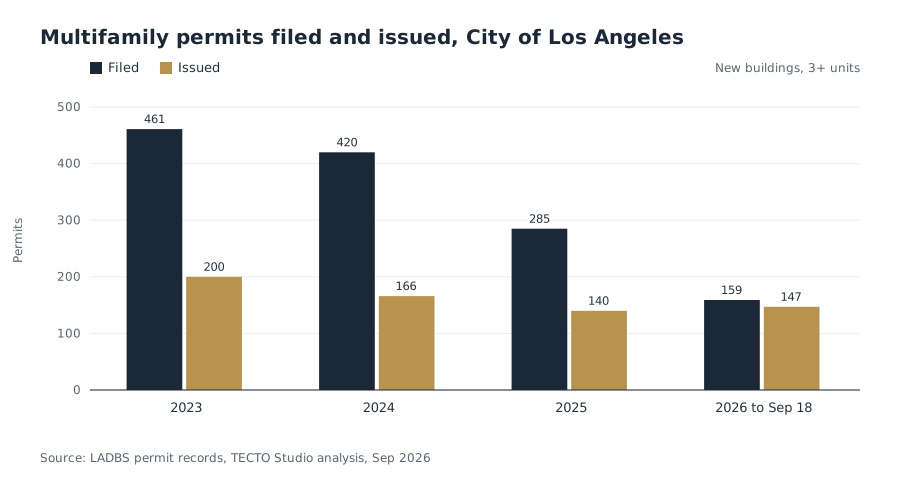
- Filings fell by about half in three years. New multifamily permit filings went from 461 in 2023 to 420 in 2024, 285 in 2025 and 159 in 2026 through September 18, about 222 at that pace for the full year.
- Issued units are up in 2026. Permits issued in 2026 through September 18 hold 10,804 units, more than the 6,645 units issued in all of 2025 (147 and 140 permits).
- A permit takes about two years from submittal to issue. Across 652 permits issued since January 2023, the median was 748 days, and the middle half took 461 to 1,174 days.
- Size barely moves the clock. The median time to issue sits between 669 and 771 days for every size band, from 3 to 9 units up to 150 units or more.
- The five-story building is the most common. Of 1,590 permits that state stories, 367 are five stories, and 84% are three to seven stories.
- Half the pool is still in review. On September 18, 2026, 828 of the 1,726 permits (48%) were waiting for or in plan check review, and 197 (11%) had corrections back.
Filings and units by year
The City's multifamily pipeline narrowed at the front and widened at the back. Filings, counted by the year a permit was first submitted to the Department of Building and Safety (LADBS), dropped every year, while issued permits held between 140 and 200 a year.
| Year | Permits filed | Units on filed permits | Permits issued | Units on issued permits |
|---|---|---|---|---|
| 2023 | 461 | 33,178 | 200 | 9,262 |
| 2024 | 420 | 31,623 | 166 | 6,990 |
| 2025 | 285 | 23,541 | 140 | 6,645 |
| 2026, to Sep 18 | 159 | 8,638 | 147 | 10,804 |
Units are as stated on each permit (n = 1,669 permits with a unit count). A project can hold more than one permit, for example a zoning review filing and the building permit that follows it, so the filed units count some projects twice; the issued column does not have that overlap in practice, because a building is issued once.
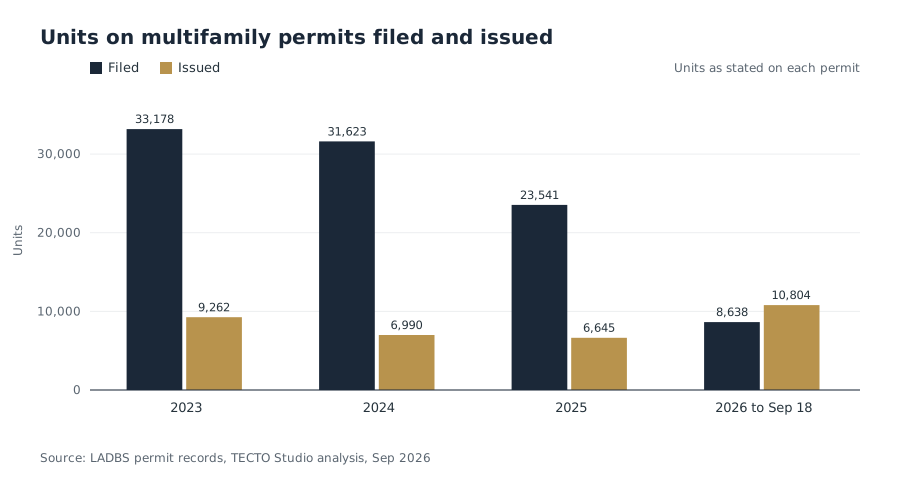
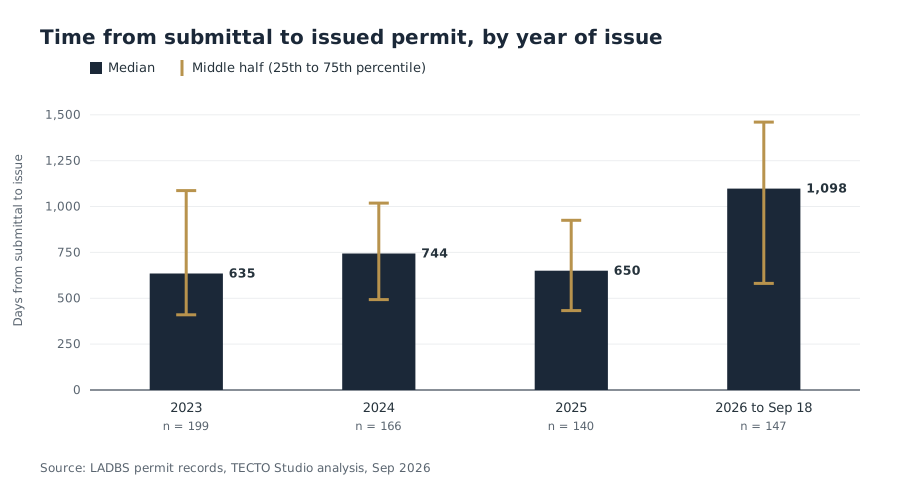
The rise in issued units during 2026 comes from older filings clearing review: the median permit issued in 2026 was first submitted 1,098 days before its issue date, so most were filed in 2023 or earlier. For a practice, that means the construction document work behind 2026 issuances was done three or more years earlier, and the drop in new filings is the signal for the sets that will be drawn next.
Time from submittal to issue
The median permit issued since January 2023 took 748 days from its first submittal to its issue date (n = 652 permits with both dates). That figure covers everything between the two dates: plan check review, corrections and resubmittals, agency clearances and fees.
| Year of issue | Permits | 25th percentile | Median | 75th percentile |
|---|---|---|---|---|
| 2023 | 199 | 410 days | 635 days | 1,087 days |
| 2024 | 166 | 493 days | 744 days | 1,019 days |
| 2025 | 140 | 433 days | 650 days | 925 days |
| 2026, to Sep 18 | 147 | 581 days | 1,098 days | 1,460 days |
The 2026 median of 1,098 days reflects which permits are clearing: older filings that waited longer. It is a reading of the backlog, and it says less about how long a set filed today will take.
By building size
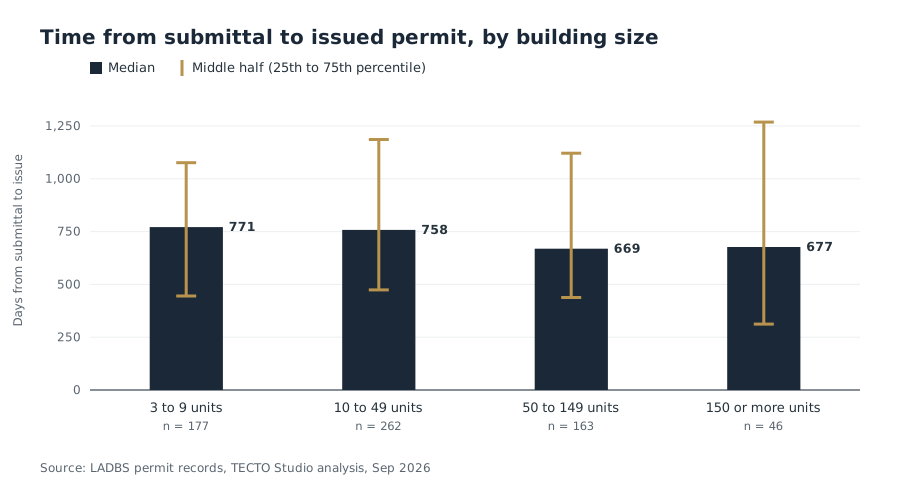
| Units on the permit | Permits | Median days | Middle half |
|---|---|---|---|
| 3 to 9 | 177 | 771 | 445 to 1,076 |
| 10 to 49 | 262 | 758 | 474 to 1,186 |
| 50 to 149 | 163 | 669 | 438 to 1,121 |
| 150 or more | 46 | 677 | 315 to 1,268 |
Small buildings do not move faster. A seven-unit building and a 160-unit building wait in the same queues for the same reviews, and the larger projects tend to come with teams that answer corrections quickly.
By construction type
Where the permit states a construction type, the medians are close: Type V-A (wood frame) 728 days (n = 261), Type III-A 750 days (n = 241) and Type V-B 771 days (n = 132). The building sizes differ more than the times: the median Type V-B permit holds 5 units, Type V-A 21 units and Type III-A 60 units. Type I-A, the concrete or steel high-rise type, appears on only 8 permits, with a median of 136 units. 798 permits state no construction type, mostly applications still in review.
Stories and height
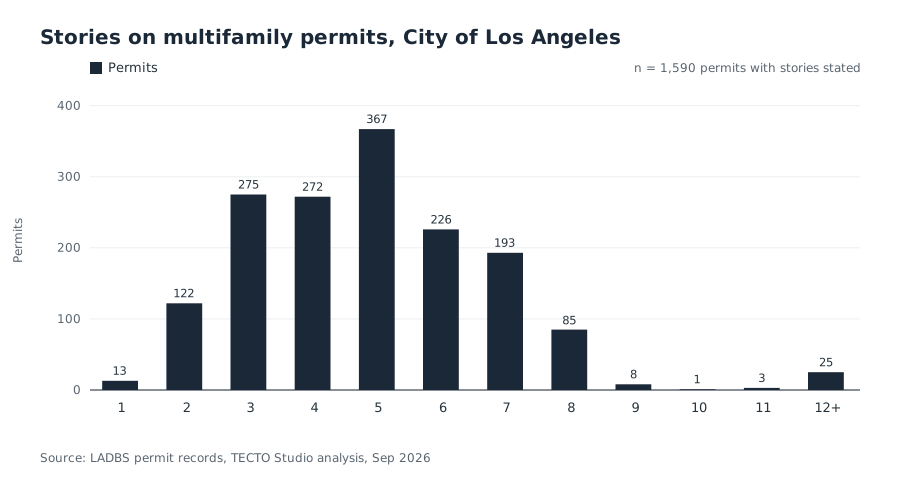
The median permit is five stories (n = 1,590 permits that state stories). Five stories is also the most common count (367 permits), followed by three (275), four (272), six (226) and seven (193). Together, three to seven stories account for 1,333 permits, 84% of the total. Only 37 permits are nine stories or more.
Height, where stated (n = 811 permits), has a median of 50 feet, and the middle half falls between 36 and 65 feet. That is the envelope of the podium building: wood frame stories over a concrete base, under the height limits the podium code guide sets out.
Where the units are
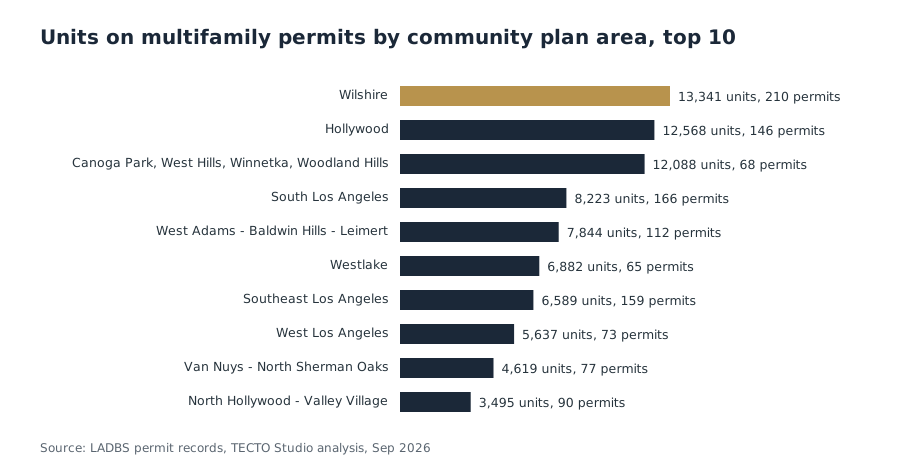
The permits spread across 36 community plan area values as LADBS records them. Wilshire leads with 13,341 units on 210 permits, followed by Hollywood (12,568 units, 146 permits) and the Canoga Park, West Hills, Winnetka and Woodland Hills area (12,088 units on 68 permits, a few very large projects). By council district, District 13 leads with 15,246 units on 189 permits, then District 3 (13,169 units, 82 permits) and District 1 (11,627 units, 129 permits).
| Community plan area | Permits | Units |
|---|---|---|
| Wilshire | 210 | 13,341 |
| Hollywood | 146 | 12,568 |
| Canoga Park, West Hills, Winnetka, Woodland Hills | 68 | 12,088 |
| South Los Angeles | 166 | 8,223 |
| West Adams, Baldwin Hills, Leimert | 112 | 7,844 |
| Westlake | 65 | 6,882 |
| Southeast Los Angeles | 159 | 6,589 |
| West Los Angeles | 73 | 5,637 |
| Van Nuys, North Sherman Oaks | 77 | 4,619 |
| North Hollywood, Valley Village | 90 | 3,495 |
Where the permits stand
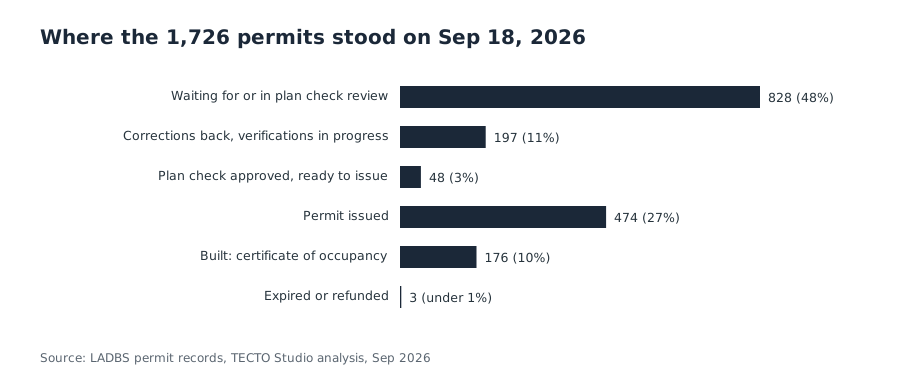
| Status on Sep 18, 2026 | Permits | Share |
|---|---|---|
| Waiting for or in plan check review | 828 | 48% |
| Corrections back, verifications in progress | 197 | 11% |
| Plan check approved, ready to issue | 48 | 3% |
| Permit issued | 474 | 27% |
| Built, certificate of occupancy | 176 | 10% |
| Expired or refunded | 3 | under 1% |
The largest single status is "Quality Review Completed" (812 permits): intake is done and the file waits for or sits in plan check. The 197 permits in verifications are the ones with a correction sheet back, where the response letter and revised sheets decide the next weeks; the corrections guide covers that step.
What it means for a multifamily set
- Plan the schedule around two years. From first submittal to issued permit, the typical multifamily permit took about 25 months, and a quarter took more than three years. The construction document set is only the start of that time.
- The time sits in review, corrections and clearances. With size barely changing the median, the controllable part of the clock is how fast each correction round is answered and how early the clearances are started.
- The next sets are being decided now. Filings dropped to about 222 for 2026 at the current pace, so the projects that do move forward compete for the same reviewers with fewer, better-prepared submittals.
- Five stories over a podium is the standard case. A set for a five-story building with a concrete base is the one plan checkers see most, and the one a production team needs to know cold.
Method and limits
Source. LADBS permit records for the City of Los Angeles (not the county): the City's open data on building permits submitted and issued from 2020, merged by permit number, then one LADBS permit detail page per permit, read between September 27 and 28, 2026. The data date is September 18, 2026.
Scope. New-building permits filed or issued since January 1, 2023, kept as multifamily when the permit is an apartment with three or more units (1,522 permits), a mixed-use building with units (147), or an apartment whose units are unstated but whose description or valuation shows housing (57). Accessory structures, accessory dwelling units, buildings under three units and non-housing commercial permits are excluded. The analysis uses the 1,726 base permits and leaves out 116 supplemental permits. Some permits issued since 2023 were first submitted years earlier.
Fields. Units come from the dwelling-unit change on the permit when it is three or more (837 permits), otherwise from the largest unit count in the work description (832); 57 permits state no unit count. Stories come from the work description. "Days to issue" is the issue date minus the first submittal date in the permit's status history. Construction type is read from the permit's construction field.
Limits. LADBS adds contact information late in review: the designer of record is named on 72% of issued permits (470 of 653) but on 20% of 2026 filings (31 of 159), so this analysis names no firm and does not rank anyone. Filed units can count a project twice where a zoning review filing and a building permit both exist. Community plan area and council district are as LADBS records them.
Download the aggregate data (CSV, every table on this page).
Sources
- LADBS, Building Permits Issued from 2020 to Present (Los Angeles Open Data)
- LADBS, Building Permits Submitted from 2020 to Present (Los Angeles Open Data)
- LADBS, Permit and Inspection Report (permit detail pages)
- TECTO Studio analysis of the records above, September 2026.